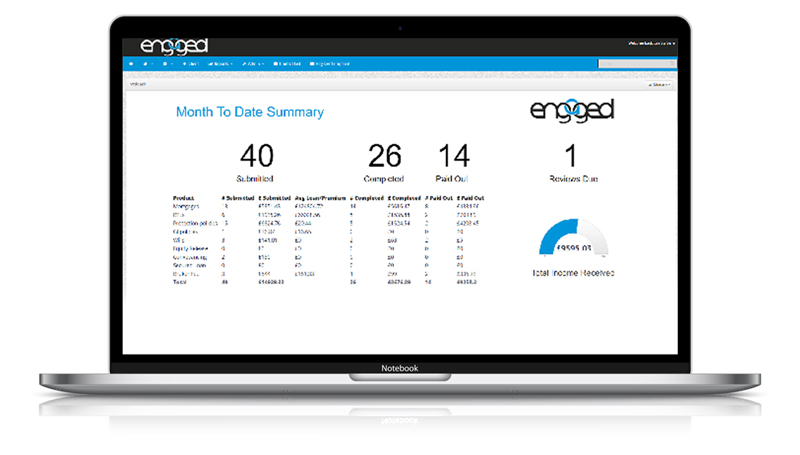
Dashboards

ER CRM offers high-level dashboards that provide real-time, visual insights across your entire business, helping you make faster, data-driven decisions.
Use clear graphical displays to track key metrics, spot trends, and monitor year-on-year performance at a glance. Compare current results with previous periods to quickly identify growth opportunities or areas for improvement.
Boost motivation across your teams with live sales leaderboards by team or department, encouraging friendly competition and performance visibility.
Each user also has access to their own personalised dashboard, displaying pipeline KPIs and progress towards individual targets — keeping everyone focused and accountable.
The dashboard can be designed to display different information dependent on different levels within the business – Team Leaders or Management for exampleDashboards can be tailored by role, so whether you're a team leader, manager, or executive, you’ll see the data most relevant to you — all in one place.